
Get ASQ CSSBB Exam Practice Questions - Real and Updated
ASQ Six Sigma Black Belt Exam Dumps
This Bundle Pack includes Following 3 Formats
Test software
Practice Test
Answers (PDF)
CSSBB Desktop Practice
Test Software
Total Questions : 230
CSSBB Questions & Answers
(PDF)
Total Questions : 230
CSSBB Web Based Self Assessment Practice Test
Following are some CSSBB Exam Questions for Review
A team wants a technique for doing an initial study of a process that not every team member is familiar with. They should use:
An x-bar and R chart is used to monitor a process. One week ago a new type of raw material was introduced and since that time 60 points have been plotted on the xbar chart and all are in the middle third of the chart. The corresponding 60 points on the R chart are all below the average range. This indicates that:
This will be a:
This QFD matrix was used in the design process for a ball point pen.
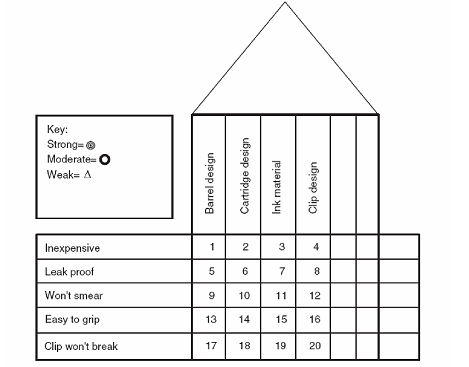
What symbol is appropriate for the square labeled 8?
SCENARIO
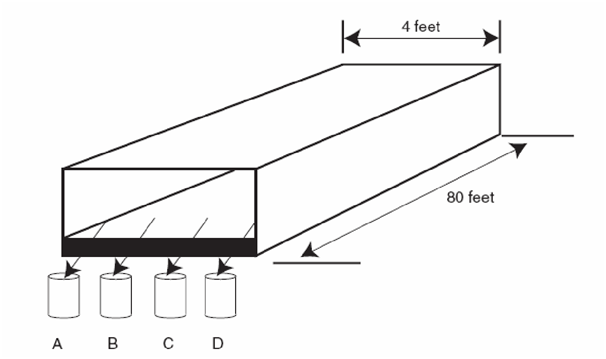
A Six Sigma team is measuring the moisture content of corn starch as it leaves the conveyer belt of a dryer. They collect one sample four cups of starch at times indicated in the chart at fixed locations labeled A, B, C, and D across the end of the belt. See the diagram below.
After some more work on the dryer, additional data are collected which when plotted looks like this:
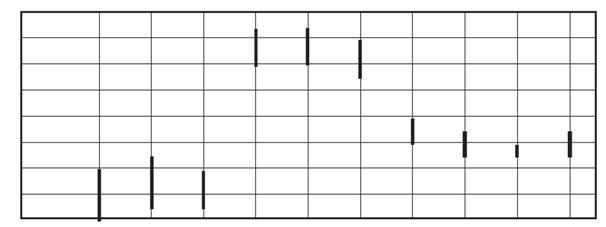
Which type of variation dominates?
Unlock All Features of ASQ CSSBB Dumps Software
Types you want
pass percentage
(Hours: Minutes)
Practice test with
limited questions
Support


