
Get Workday-Pro-HCM-Reporting Exam Practice Questions - Real and Updated
Workday Pro HCM Reporting Certification Exam Dumps
This Bundle Pack includes Following 3 Formats
Test software
Practice Test
Answers (PDF)

Workday-Pro-HCM-Reporting Desktop Practice
Test Software
Total Questions : 59

Workday-Pro-HCM-Reporting Questions & Answers
(PDF)
Total Questions : 59

Workday-Pro-HCM-Reporting Web Based Self Assessment Practice Test
Following are some Workday-Pro-HCM-Reporting Exam Questions for Review
You have created a composite report and are trying to add a matrix report as a subreport. However, when trying to configure a Data column, the matrix report is not available to select in the Sub Report Name field.
What can you check to identify the cause of this issue?
How can you view the latest content housed in WDSetup?
A report that uses an indexed data source is running slowly for an HR analyst. The report is sorted by the Worker object field.
What can you do to improve the sorting performance?
A customer was receiving a report on a weekly basis but has not received it since the new year started.
What task should you use to confirm the report frequency?
Refer to the following scenario to answer the question below.
You have prepared the following matrix report for a recruiting manager.
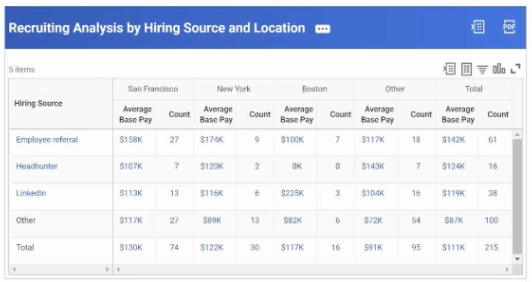
The recruiting manager wants the rows to sort by Total Count, rather than Total Average Base Pay.
How can you adjust the report definition to address this requirement?
Unlock All Features of Workday-Pro-HCM-Reporting Dumps Software
Types you want
pass percentage
(Hours: Minutes)
Practice test with
limited questions
Support


