
Get WGU Applied Algebra Exam Practice Questions - Real and Updated
WGU Applied Algebra FXO2 PFXP C957 Exam Dumps
This Bundle Pack includes Following 3 Formats
Test software
Practice Test
Answers (PDF)

Applied Algebra Desktop Practice
Test Software
Total Questions : 94

Applied Algebra Questions & Answers
(PDF)
Total Questions : 94

Applied Algebra Web Based Self Assessment Practice Test
Following are some Applied Algebra Exam Questions for Review
A researcher collected data on the number of members in a national association over time. The results are shown in the scatterplot. The graphed regression function has an value of .
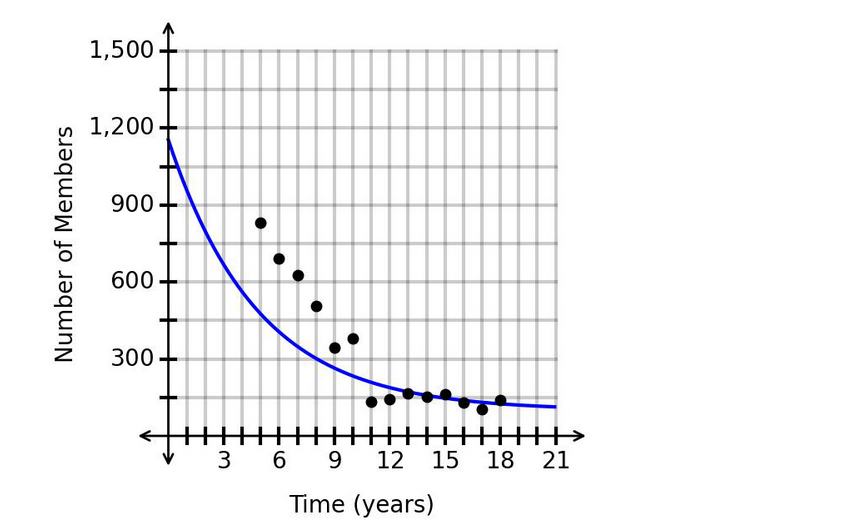
Is it appropriate to make a prediction for the number of members after years?
The function represents the value of an investment account, where is the number of years since the account was opened. The graph of the function is shown.
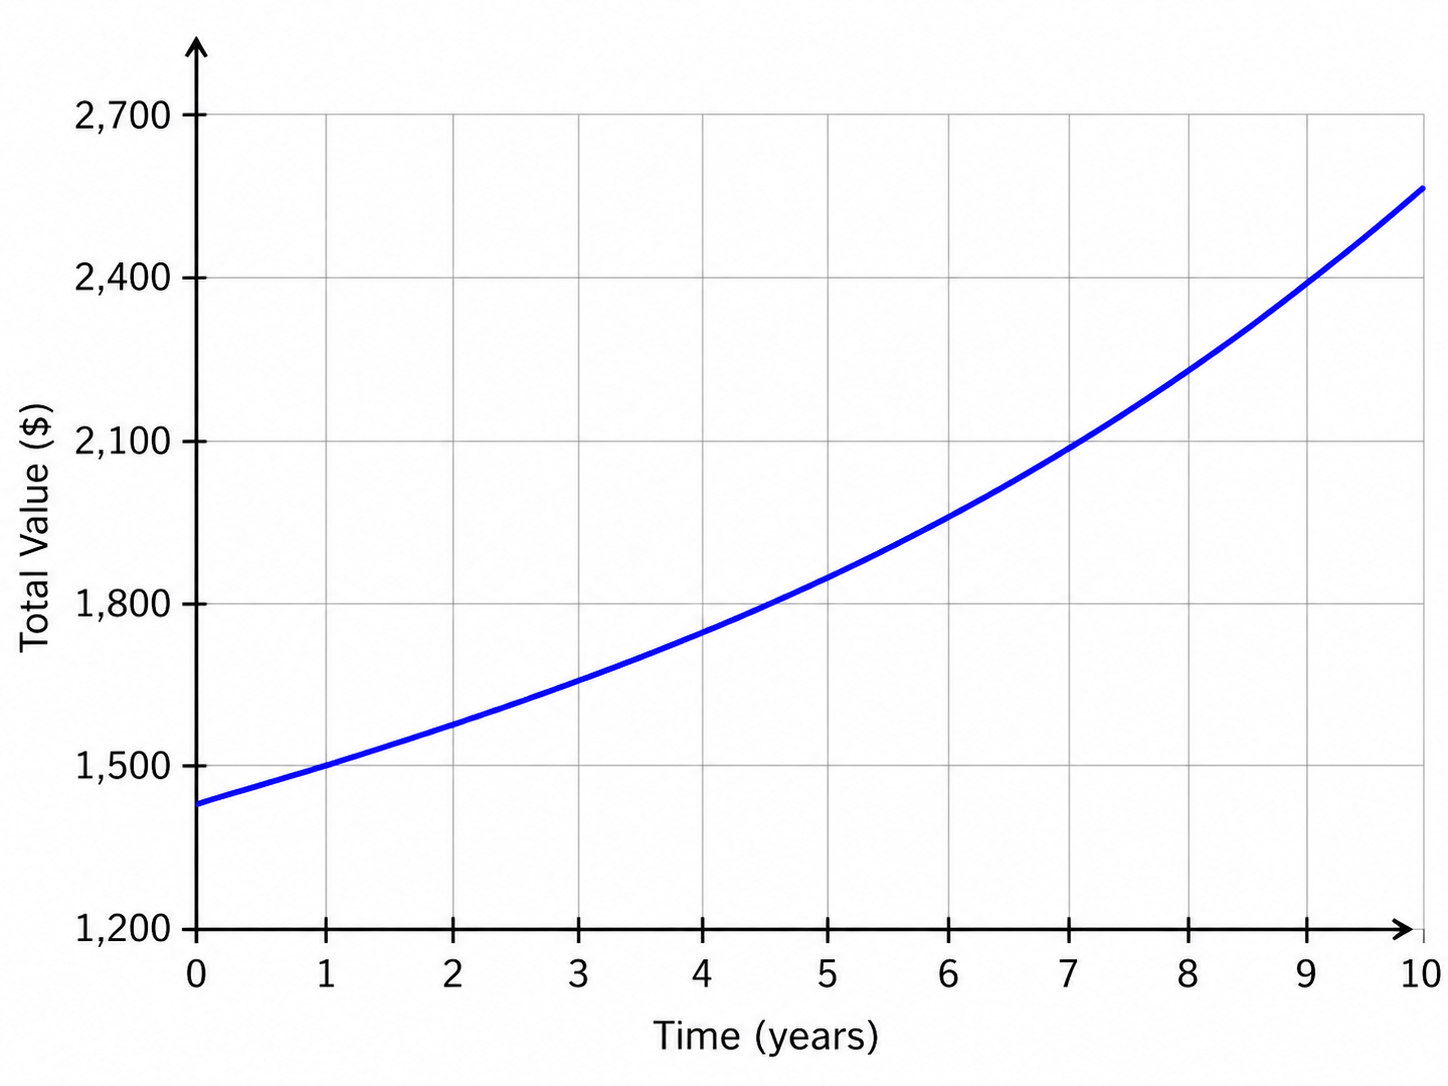
What is the total value when x=4?
The function represents the number of active players, , in a game hours after 11:00 a.m. The graph of is shown.
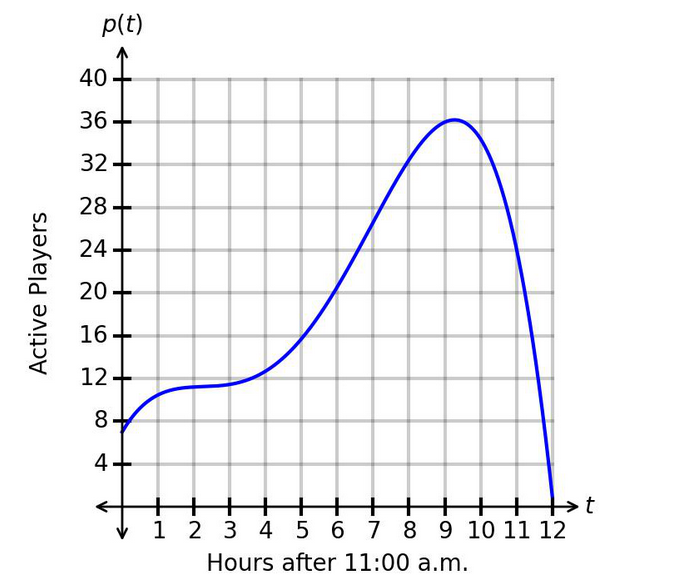
What is one example of an interval for which the number of players is decreasing faster and faster?
The scatterplot shows data on the usage of a computer's CPU over time. The graphed regression function has an value of .
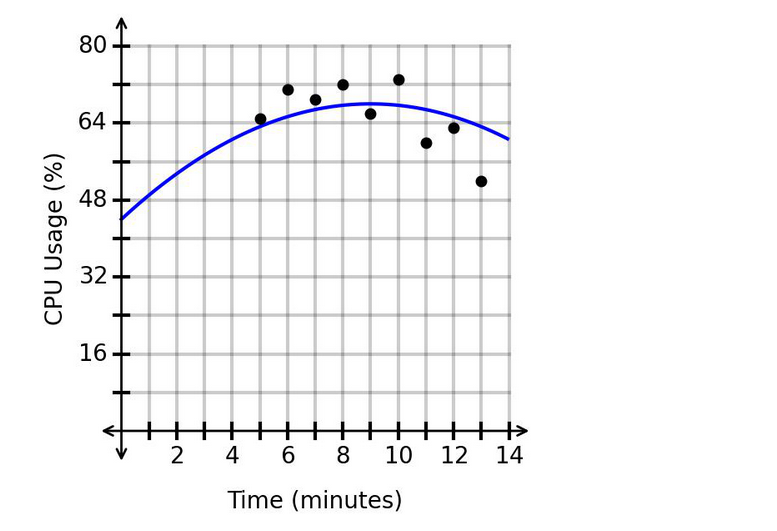
What is the appropriate range of -values for extrapolation?
In the graph showing the number of daily homework problems assigned for a math class, the horizontal axis shows the number of school days since the beginning of the term and the vertical axis shows the number of daily homework problems.
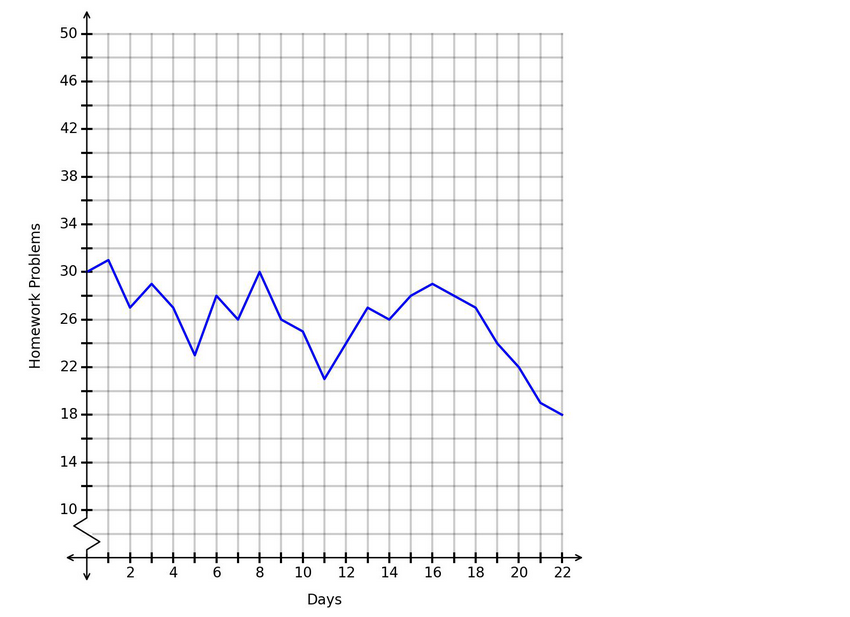
Which conclusion is correct based on this graph?
Unlock All Features of WGU Applied Algebra Dumps Software
Types you want
pass percentage
(Hours: Minutes)
Practice test with
limited questions
Support


