
Get Salesforce Analytics-DA-201 Exam Practice Questions - Real and Updated
Salesforce Certified Tableau Data Analyst Exam Dumps
This Bundle Pack includes Following 3 Formats
Test software
Practice Test
Answers (PDF)

Analytics-DA-201 Desktop Practice
Test Software
Total Questions : 174

Analytics-DA-201 Questions & Answers
(PDF)
Total Questions : 174

Analytics-DA-201 Web Based Self Assessment Practice Test
Following are some Analytics-DA-201 Exam Questions for Review
You plan to create a Tableau subscription for several users.
Which two formats can you use? Choose two.
You have the following dataset in Microsoft Excel.
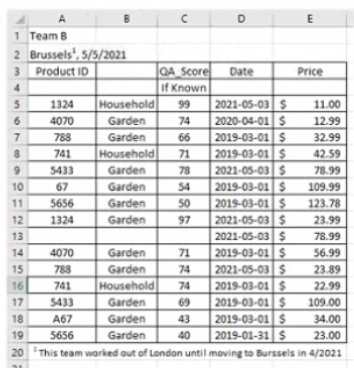
You are using Data interpreter to cleans the dataset. Data interpreter provides the following results.
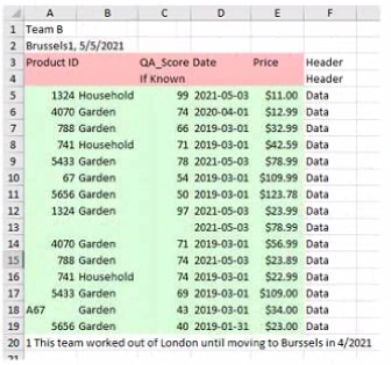
How many rows of data will be ingested into Tableau as values?
You need the top 10 values to appear in a different color. The lop 10 values must be colored dynamically.
What should you do?
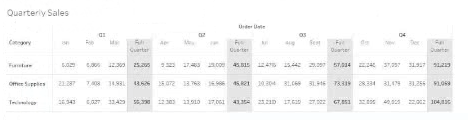
Which option must a Data Analyst enable to build the following table to add quarterly totals?
A Data Analyst has the following chart that shows the sum of sales made in different cities.
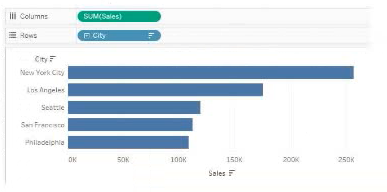
The analyst wants to show the average sale amount for a city when users hover their mouse over any of the bars.
What should the analyst do?
Unlock All Features of Salesforce Analytics-DA-201 Dumps Software
Types you want
pass percentage
(Hours: Minutes)
Practice test with
limited questions
Support


