
Get Tableau TDS-C01 Exam Practice Questions - Real and Updated
Tableau Desktop Specialist Exam Dumps
RETIRED
This Bundle Pack includes Following 3 Formats
Desktop Practice
Test software
Test software
Web Based
Practice Test
Practice Test
Questions &
Answers (PDF)
Answers (PDF)

TDS-C01 Desktop Practice
Test Software
Last Updated : 31-07-2025
Total Questions : 317
Total Questions : 317
$59.00

TDS-C01 Questions & Answers
(PDF)
Last Updated : 31-07-2025
Total Questions : 317
Total Questions : 317
$59.00

TDS-C01 Web Based Self Assessment Practice Test
Last Updated : 31-07-2025
317 Total Questions
Supported Browsers
Supported Platforms
License Options
$59.00
Following are some TDS-C01 Exam Questions for Review
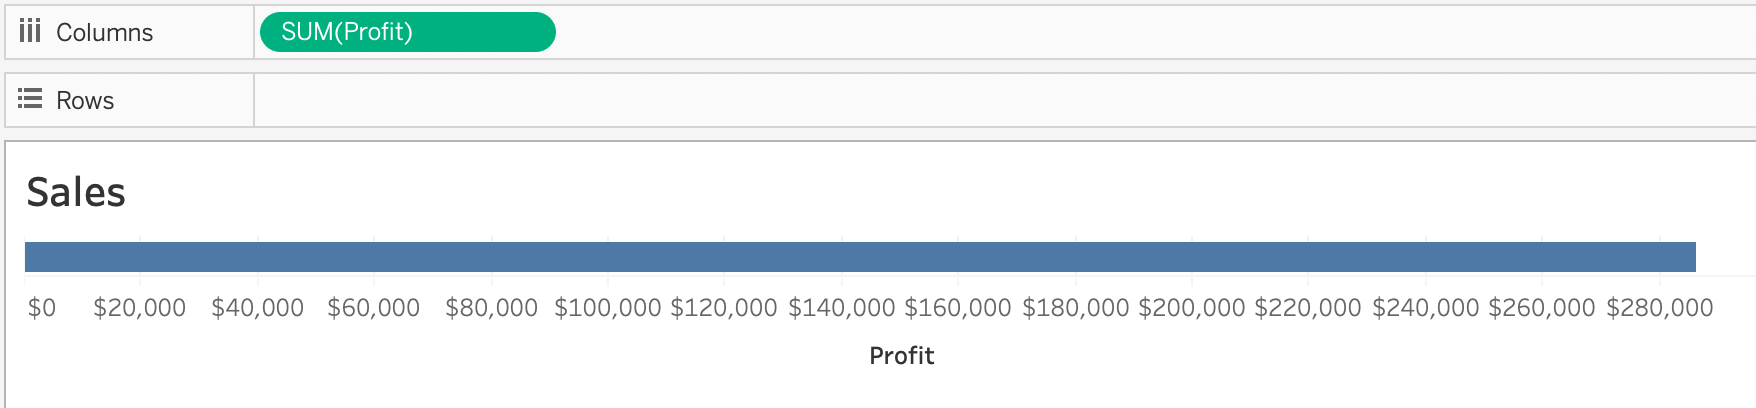
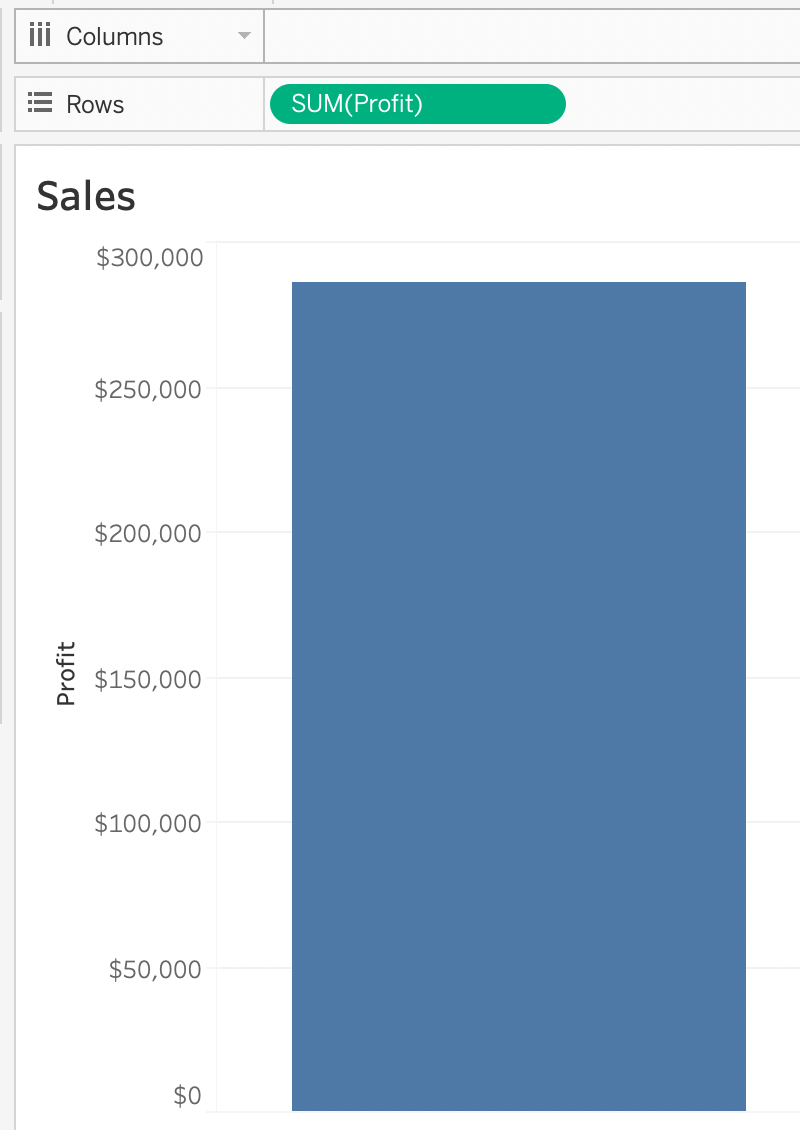
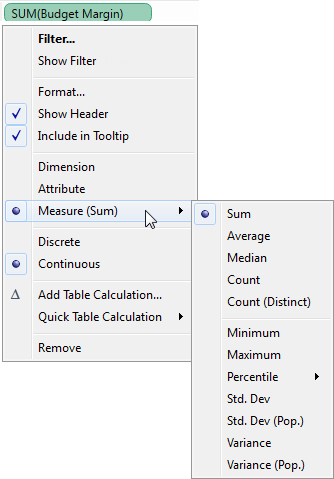
You just added this field to the Columns shelf.

What will this create?
Which type of chart can you create without using a dimension?
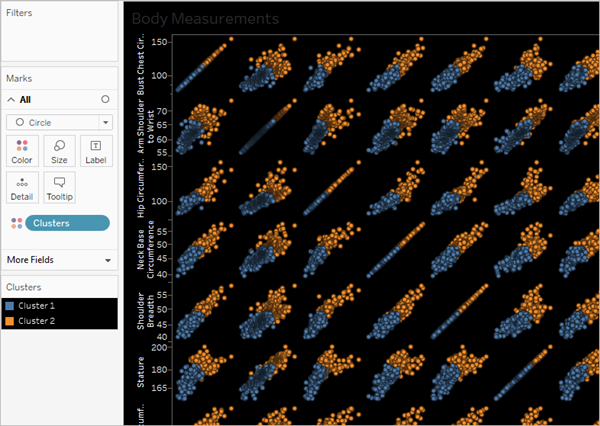
__________ is a technique in Tableau which will identify marks with similar characteristics
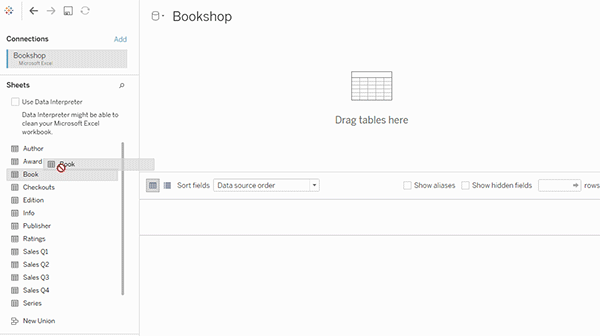
True or False:When you drag additional tables to the logical layer canvas, Tableau automatically attempts to create the relationship based on existing key constraints and matching fields to define the relationship. If it can't determine the matching fields, then relating these tables is not possible.
How does Tableau know at which level to aggregate values?
Unlock All Features of Tableau TDS-C01 Dumps Software
Just have a look at the best and updated features of our TDS-C01 dumps which are described in detail in the following tabs. We are very confident that you will get the best deal on this platform.
Select Question
Types you want
Types you want
Set your desired
pass percentage
pass percentage
Allocate Time
(Hours: Minutes)
(Hours: Minutes)
Create Multiple
Practice test with
limited questions
Practice test with
limited questions
Customer
Support
Support
Latest Success Metrics For actual TDS-C01 Exam
This is the best time to verify your skills and accelerate your career. Check out last week's results, more than 90% of students passed their exam with good scores. You may be the Next successful Candidate.
95%
Average Passing Scores in final Exam
91%
Exactly Same Questions from these dumps
90%
Customers Passed Tableau TDS-C01 exam


