
Get Salesforce Analytics-Con-301 Exam Practice Questions - Real and Updated
Salesforce Certified Tableau Consultant Exam Dumps
This Bundle Pack includes Following 3 Formats
Test software
Practice Test
Answers (PDF)

Analytics-Con-301 Desktop Practice
Test Software
Total Questions : 100

Analytics-Con-301 Questions & Answers
(PDF)
Total Questions : 100

Analytics-Con-301 Web Based Self Assessment Practice Test
Following are some Analytics-Con-301 Exam Questions for Review
A client builds a dashboard that presents current and long-term stock measures. Currently, the data is at a daily level. The data presents as a bar chart that
presents monthly results over current and previous years. Some measures must present as monthly averages.
What should the consultant recommend to limit the data source for optimal performance?
A consultant wants to improve the performance of reports by moving calculations to the data layer and materializing them in the extract.
Which type of calculation is the consultant able to move?
A client has a data source that stores a time stamp for each time a user interacts with a product feature. They visualize 3 years of data at the daily level. As adoption has grown over the last 6 months, the dashboard performance has steadily decreased, despite connecting via a data extract that is set to refresh every hour.
A Tableau consultant needs to improve performance of the dashboard with the least impact to the visualization.
Which option meets these requirements without additional cost?
SIMULATION
Use the following login credentials to sign in
to the virtual machine:
Username: Admin
Password:
The following information is for technical
support purposes only:
Lab Instance: 40201223
To access Tableau Help, you can open the
Help.pdf file on the desktop.
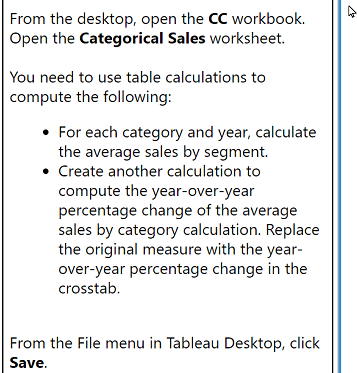
From the desktop, open the CC workbook.
Open the Categorical Sales worksheet.
You need to use table calculations to
compute the following:
. For each category and year, calculate
the average sales by segment.
. Create another calculation to
compute the year-over-year
percentage change of the average
sales by category calculation. Replace
the original measure with the year-
over-year percentage change in the
crosstab.
From the File menu in Tableau Desktop, click
Save.
A Tableau consultant is tasked with choosing a method of setting up row-level security (RLS) entitlements with tables during a Tableau implementation. The consultant has received a set of roles from a client in one normalized table, and a set of entitlements from the client in another normalized table.
The consultant plans on using the deepest granularity method. However, when the consultant gains access to the final set of data, they discover duplicate values at the lowest level. Most of the regions in the client's dataset contain sub-regions named 'East' and 'West'. However, some regions have a 'Null' value for sub-region.
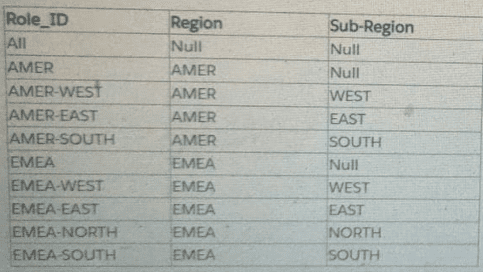
How should the consultant proceed?
Unlock All Features of Salesforce Analytics-Con-301 Dumps Software
Types you want
pass percentage
(Hours: Minutes)
Practice test with
limited questions
Support


