
Get Microsoft PL-300 Exam Practice Questions - Real and Updated
Microsoft Power BI Data Analyst Exam Dumps
This Bundle Pack includes Following 3 Formats
Test software
Practice Test
Answers (PDF)

PL-300 Desktop Practice
Test Software
Total Questions : 464

PL-300 Questions & Answers
(PDF)
Total Questions : 464

PL-300 Web Based Self Assessment Practice Test
Following are some PL-300 Exam Questions for Review
You are building a Power Bl report that uses data from an Azure SQL database named erp1.
You Import the following tables.
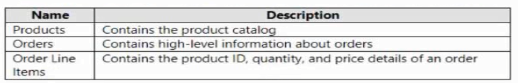
You need to perform the following analyses:
* Orders sold over time that include a measure of the total order value
* Orders by attributes of products sold
The solution must minimize update times when interacting with visuals in the report. What should you do first?
You have multiple dashboards.
You need to ensure that when users browse the available dashboards from powerbi.com, they can see which dashboards contain Personally Identifiable Information (PII). The solution must minimize configuration effort and impact on the dashboard design.
What should you use?
Note: This question is part of a series of questions that present the same scenario. Each question in the series contains a unique solution that might meet the stated goals. Some question sets might have more than one correct solution, while others might not have a correct solution.
After you answer a question in this scenario, you will NOT be able to return to it. As a result, these questions will not appear in the review screen.
You have a clustered bar chart that contains a measure named Salary as the value and a field named Employee as the axis. Salary is present in the data as numerical amount representing US dollars.
You need to create a reference line to show which employees are above the median salary.
Solution: You create a percentile line by using the Salary measure and set the percentile to 50%.
Does this meet the goal?
You have a Power BI semantic model that contains a table named Table1. Table1 contains the following columns:
* WebsiteName
* URL
You need to create a report named Report1 that will contain a table visual. The solution must meet the following requirements.
* Display the website name
* Enable users to navigate to the website's URL by selecting the website name.
What should you use?
You need to create the relationship between the product list and the revenue results. The solution must minimize the time it takes to render visuals.
What should you set as the relationship cardinality?
Unlock All Features of Microsoft PL-300 Dumps Software
Types you want
pass percentage
(Hours: Minutes)
Practice test with
limited questions
Support


