
Get CFA Institute CFA-Level-II Exam Practice Questions - Real and Updated
CFA Institute CFA Level II Chartered Financial Analyst Exam Dumps
This Bundle Pack includes Following 3 Formats
Test software
Practice Test
Answers (PDF)

CFA-Level-II Desktop Practice
Test Software
Total Questions : 715

CFA-Level-II Questions & Answers
(PDF)
Total Questions : 715

CFA-Level-II Web Based Self Assessment Practice Test


Following are some CFA-Level-II Exam Questions for Review


Lorenz Kummert is a junior equity analyst who is following Schubert, Inc. (Schubert), a small publicly traded company in the United States. His supervisor, Markus Alter, CFA, has advised him to use the residual income model to analyze Schubert.
In his preliminary report to Alter, Kummert makes the following statements:
Statement 1: Residual income models are appropriate when expected free cash flows are negative for the foreseeable future.
Statement 2: Residual income models are not applicable when cash flows are volatile.
Kummert has determined Schubert's cost of equity, cost of debt, and weighted average cost of capital (WACC) to be 12.8%, 8.4%, and 11.9%, respectively. The current price of the stock is $35 per share and there are 130,000 shares outstanding. The relevant tax rate is 30%, and return on equity (ROE) is expected to be 13%.
Summarized financial information about Schubert for 2008 is provided in Exhibits I and II.
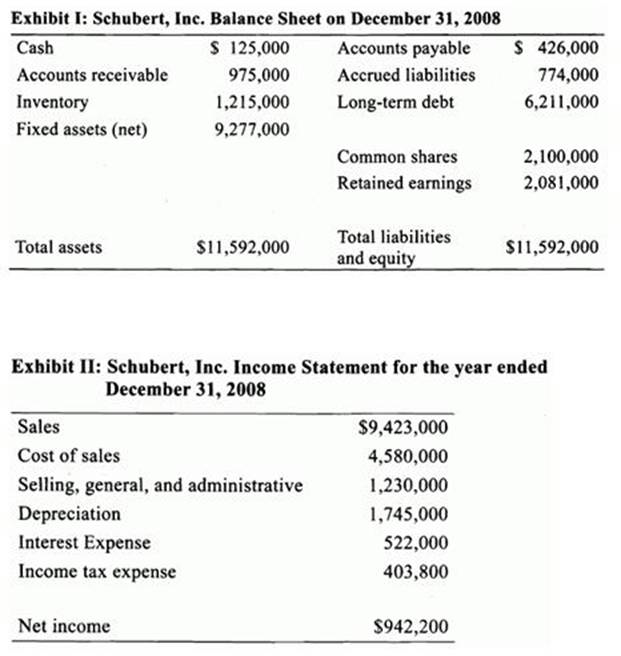
Based on his analysis of several years of financial statements, Kummert notes that 2008 was an exceptionally profitable year for Schubert, and that its dividend payouts are usually low because the funds are mainly reinvested in the firm to promote growth. Furthermore, there are very few nonrecurring items on the income statement. Upon review of Kummert's preliminary report, Alter concurs with his analysis of the financial statements but reminds him that Schubert's long-term debt is currently trading at 95% of its book value. He also cautions Kummert that violations of the clean surplus relation can bias the results of the residual income model.
The consensus annual EPS estimate for 2009 is $6.15, and the dividend payout ratio for 2009 is estimated at 5%.
Assuming that Kummert and Alter are correct with their conclusions regarding Schubert's financial statements, which of the following levels would best describe the strength of the persistence factor with respect to Schubert's residual income?
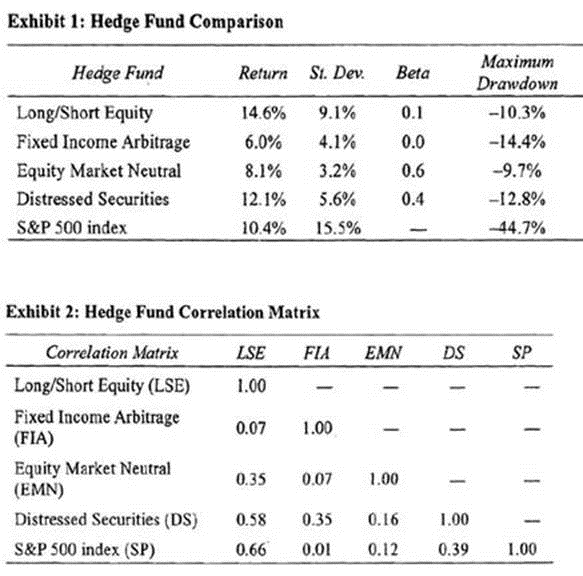
A client of Colby Nash, CFA, wants to add an alternative asset class to his portfolio. However, the client is concerned that any investment in hedge funds may be far riskier and generate lower returns than is generally expected. Nash believes the client's attitude toward hedge funds was influenced by negative press coverage regarding fraud perpetrated by a few funds. Nash decided to conduct his own research on the risk/reward characteristics of hedge funds. Nash generated a report (shown in Exhibit 1) comparing several hedge fund strategies and a traditional investment benchmark; the S&P 500 index. Each hedge fund strategy is represented by an individual fund, which is used to measure risk and return over a ten year period. Nash also created a correlation matrix between hedge funds and the S&P 500 index, shown in Exhibit 2.
In addition to the statistics presented in the exhibits above, Nash created a hedge fund index to evaluate each fund's performance. Nash recognized the fact that several shortcomings exist in creating an adequate hedge fund index. To that end, Nash created an index in which all the hedge funds included in the index agreed to provide data that can be verified by Nash. Nash also set up strict rules for inclusion and removal of hedge funds into and out of the hedge fund index.
As a further improvement to his research, Nash created a positive risk-free rate benchmark to evaluate each hedge fund. However, his review of academic research indicated thar the positive risk-free rate benchmark is only appropriate for a limited number of hedge fund strategies. The current risk-free rate is 4%.
Nash conducted a personal interview with the portfolio manager of the Fixed Income Arbitrage hedge fund. The portfolio manager disclosed that he exploited pricing inefficiencies between fixed income securities while hedging exposure to interest rate risk. The portfolio manager utilizes a convergence trading strategy, which assumes that the price difference between two similar assets will narrow in the future. The portfolio manager is willing to invest in illiquid bonds if the opportunity presents itself.
in reviewing the correlation matrix (Exhibit 2), Nash concluded that the Fixed Income Arbitrage hedge fund would be an ideal addition to his client's current traditional investment portfolio. Nash's rationale was that a low correlation between the hedge fund and the S&P 500 index will assure that the fund's returns will be positive when the returns of the index are negative.
After reviewing Nash's research, the Director of Research at his firm inquired why he did not examine the value at risk (VAR) measure for the various hedge fund strategies. Nash stated that VAR is an ineffective statistical measure of risk when a hedge fund has high turnover or frequent changes in its strategy. In addition, Nash stated his belief that when the only input is historical data, VAR does not provide a reliable estimate of future risk.
Nash stated that correlation analysis indicated that the Fixed Income Arbitrage hedge fund should be added to his client's traditional investment portfolio and Nash outlines his rationale for not including VAR in his analysis of hedge funds. Which of his statements is correct?
Ernie Smith and Jama! Sims are analysts with the firm of Madison Consultants. Madison provides statistical modeling and advice to portfolio managers throughout the United States and Canada.
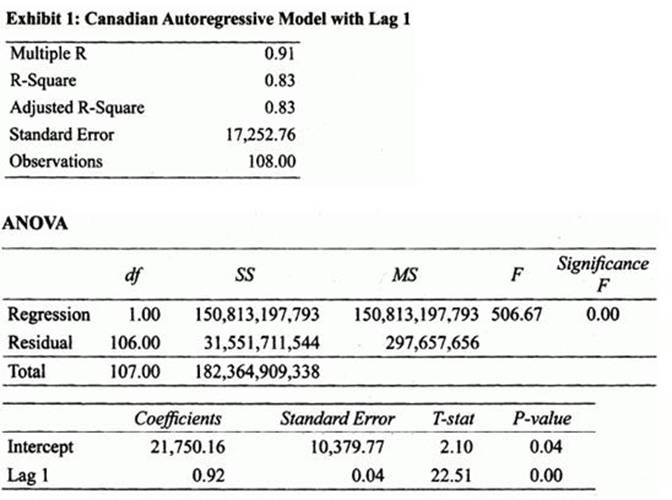
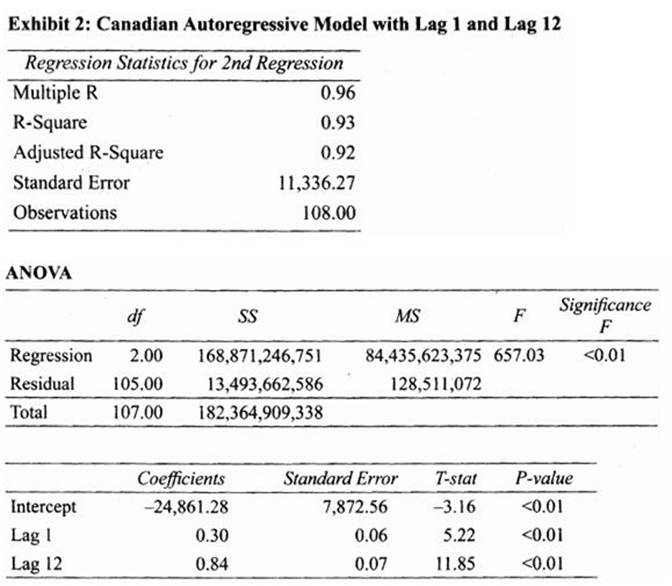
In an effort to estimate future cash flows and value the Canadian stock market. Smith has been examining* the country's aggregate retail sales. He runs two autoregressive regression models in an attempt to determine whether there are any patterns in the data, utilizing nine years of unadjusted monthly retail sales data. One model uses a lag one variable and the other adds a lag twelve variable. The results of both regressions are shown in Exhibits 1 and 2.
Sims has been assigned the task of valuing the U .S . stock market and uses data similar to the data that Smith uses for Canada. He decides, however, that the data should be transformed. He takes the natural log of the data and uses it in the following model:
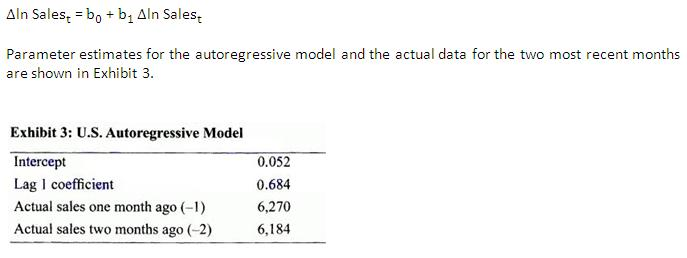
Smith and Sims are concerned that the data for Canadian retail sales may be more appropriately modeled with an ARCH process. Smith states, that in order to find out, he would take the residuals from the original autoregressive model for Canadian retail sales and then square them.
Sims states that these residuals would then be regressed against the Canadian retail sales data using the

where e represents the residual terms from the original regression and X represents the Canadian retail sales data. If is statistically different from zero, then the regression model contains an ARCH process.
Smith also examines the quarterly inflation data for an emerging market over the past nine years. He models the data using an autoregressive model with a lag one independent variable which he finds is statistically different from zero. He wonders whether he should also include lag two and lag four terms, given the magnitude of the autocorrelations of the residuals shown in Exhibit 4, assuming a 5% significance level. The critical t-values, assuming a 5% significance level and 35 degrees of freedom, are 2.03 for a two-tail test and 1.69 for a one-tail test.
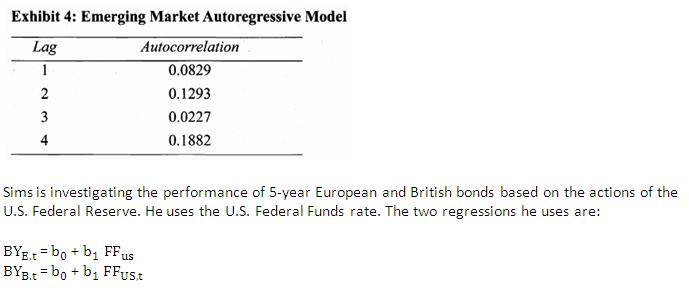
where: FF is the Federal Funds rate in the United States (US), and BY is the bond yield in the European Union (E) and Great Britain (B).
Before he runs this regression, he investigates the characteristics of the dependent and independent variables. He finds that the Federal Funds rate in the United States and the bond yield in Great Britain have a unit root but that the bond yield in the European Union does not. Furthermore, the Federal Funds rate in the United States and the bond yield in Great Britain are cointegrated but the Federal Funds rate in the United States and the bond yield in the European Union are not.
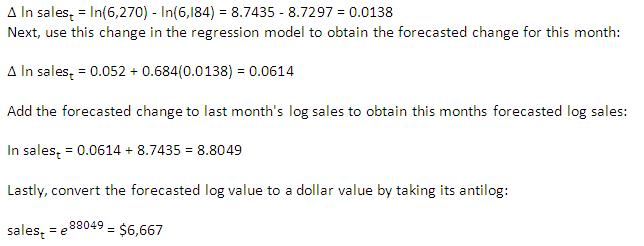
The estimate of forecasted sales for the United States this month, using Sims' model is closest to:
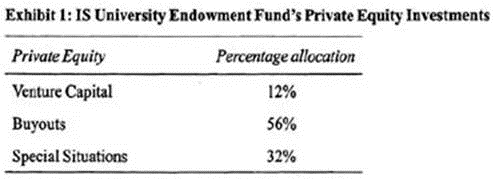
Bill Henry, CFA, is the CIO of IS University Endowment Fund located in the United States. The Fund's total assets are valued at $3.5 billion. The investment policy uses a total return approach to meet the return objective that includes a spending rate of 5%. In addition, the policy constraints established make tax-exempt instruments an inappropriate investment vehicle. The Fund's current asset mix includes an 18% allocation to private equity. The private equity allocation is shown in Exhibit 1.
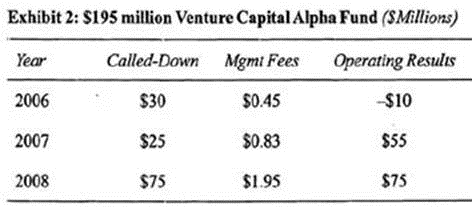
The private equity allocation is a mixture of funds with different vintages. For example, within the venture capital category, investments have been made in five different funds. Exhibit 2 provides detail about the Alpha Fund with a vintage year of 2006 and committed capital of SI95 million.
The Alpha Fund is considering a new investment in Targus Company. Targus is a start-up biotech company seeking $9 million of venture capital financing. Targus's founders believe that, based on the company's new drug pipeline, a company value of $300 million is reasonable in five years. Management at Alpha Fund views Targus Company as a risky investment and is using a discount rate of 40%. After a thorough analysis of Targus's future prospects, Alpha Fund's management believes that there is a possible 15% risk of failure for the company.
Using Exhibit 2, calculate the 2008 percentage management fee of the Alpha Fund.

Jonathan Adams, CFA, is doing some scenario analysis on forward contracts. The process involves pricing the forward contracts and then estimating their values based on likely scenarios provided by the firm's forecasting and strategy departments. The forward contracts with which Adams is most concerned are those on fixed income securities, interest rates, and currencies.
The first contract he needs to price is a 270-day forward on a $1 million Treasury bond with ten years remaining to maturity. The bond has a 5% coupon rate, has just made a coupon payment, and will make its next two coupon payments in 182 days and in 365 days. It is currently selling for 98.25. The effective annual risk-free rate is 4%. Adams is also analyzing forward rate agreements (FRAs).
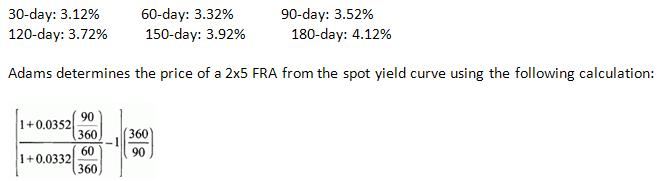
The LIBOR spot curve is as follows:
The LIBOR spot curve is as follows:
Finally, Adams wants to price and value a currency forward on euros. The euro spot rate is $1.1854. The dollar risk-free rate is 3%, and the euro risk-free rate is 4%.
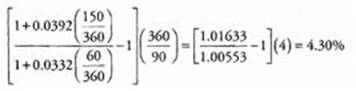
How many of the following terms are correct in the calculation of the FRA price: 0.0352, 0.0332, 60/360, 90/360?
Unlock All Features of CFA Institute CFA-Level-II Dumps Software

Types you want

pass percentage

(Hours: Minutes)

Practice test with
limited questions

Support


