Get Adobe AD0-E208 Exam Dumps
Adobe Analytics Business Practitioner Expert Exam Dumps
This Bundle Pack includes Following 3 Formats
Test software
Practice Test
Answers (PDF)

AD0-E208 Desktop Practice
Test Software
Total Questions : 50

AD0-E208 Questions & Answers
(PDF)
Total Questions : 50

AD0-E208 Web Based Self Assessment Practice Test
Following are some AD0-E208 Exam Questions for Review
Various reports show None, Unspecified, Other, or Unknown, depending on the specific report viewed. Generally, this breakdown means that the variable was not defined or otherwise unavailable.
Which statement explains the possible behavior of the data?
An analyst has been given a list of dimensions available to conduct an analysis on their hospital's doctor site.
The Solution Design Reference (SDR) contains:
eventl - Start Appointment Booking - Set on: Appointment Booking Start
event2 - Booking Complete - Set on: Appointment Booking Complete
eVarl - Doctor Type - Set on: event2
eVar2 - Number of Available Appointments - Set on eventl
propl -Appointment Pathing
Given the SDR, which report can be generated?
The web analyst for a beauty products company wants to create a report to analyze the number of sample requests for one of their product pages.
The following items are available from the default configuration:
* prop3, which registers the product page name and is fired in the first page load
* eVar4, which registers the product page name and is fired in the first page load
* event1 2, which fires when a visitor clicks on "Request a sample'' call to action
How can the analyst accomplish the creation of this report?
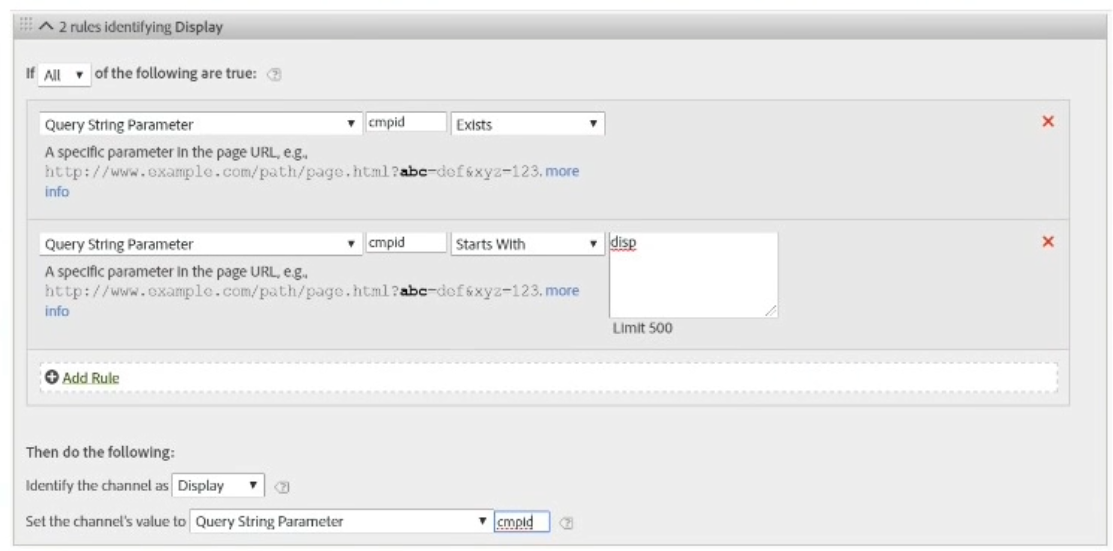
A media agency is running a Display campaign, but none of the data is credited to the Display marketing channel in Adobe Analytics.
Here are some example tracking codes provided by the media agency:
?cid=disp_lifestyle_summer2019.088653 ?cid=disp_summer2019_branding_647821 ?cid=disp_671244_hero_summer2019
The Marketing Channel Processing Rule for the Display channel is configured as follows:

What is causing the loss of data in Adobe Analytics?
A user needs to share an important segment with a group of users in a Product Profile Group. Why can't a member of his Product Profile Group view the segment?
Unlock All Features of Adobe AD0-E208 Dumps Software
Types you want
pass percentage
(Hours: Minutes)
Practice test with
limited questions
Support